Read the sales dashboard
Understand pipeline value, closed revenue, win rate and average deal size on the Home page.
The Sales Command Center on the Home page shows how your sales are going, with real-time pipeline numbers and revenue analytics.
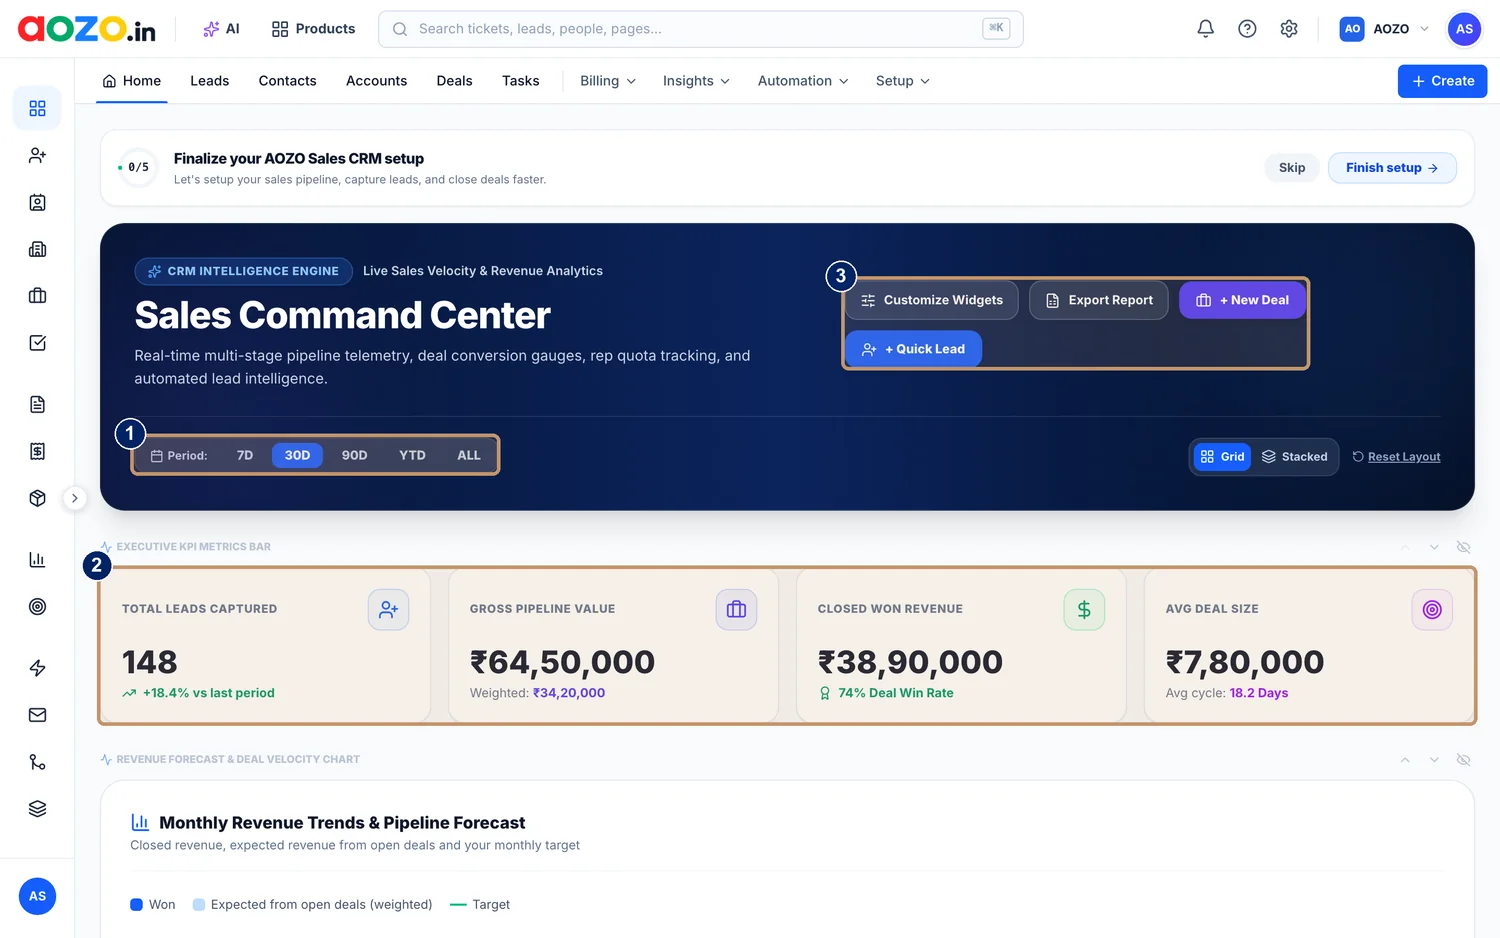
- Period switch: 7D, 30D, 90D, YTD or ALL
- Key numbers: leads, pipeline, revenue and deal size
- Customize Widgets, Export Report, + New Deal and + Quick Lead
#The key numbers
| Number | Meaning |
|---|---|
| Total leads captured | How many leads came in, with the change against the last period |
| Gross pipeline value | The value of open deals, with the weighted value beneath it |
| Closed won revenue | Revenue from won deals, with your deal win rate |
| Average deal size | The typical value of a won deal, with the average sales cycle in days |
#Use it
Choose a period
Switch between 7D, 30D, 90D, YTD and ALL to compare short and long trends.

- 7D, 30D, 90D, YTD or ALL
Read the four cards
Check leads captured, gross pipeline value, closed won revenue and average deal size.

- The four key numbers
Look at the forecast
Scroll to Monthly Revenue Trends and Pipeline Forecast. It plots closed revenue, the expected revenue from open deals (weighted) and your monthly target.
Act on it
Use + Quick Lead or + New Deal straight from the dashboard, Customize Widgets to arrange the page, or Export Report to share it.

- Customize Widgets, Export Report, + New Deal and + Quick Lead



A new workspace shows setup prompts and zeros until leads and deals arrive. The numbers fill in as you work.